Tracing the Climate Change Fingerprints on Extreme Weather Events
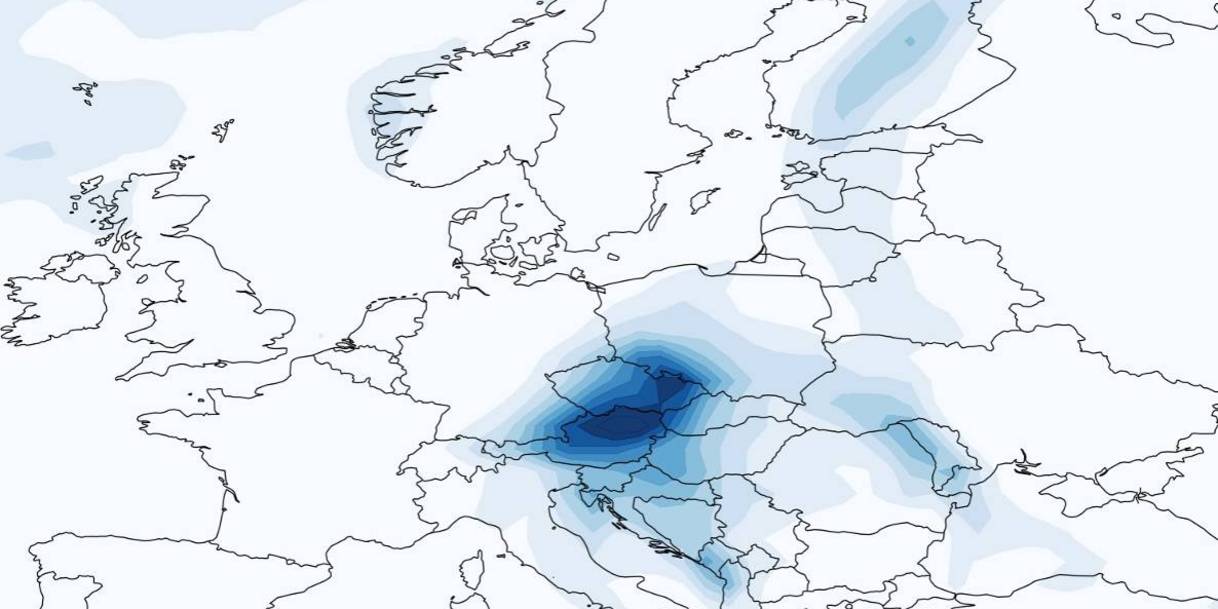
**In mid-September, Storm Boris wreaked havoc on Central and Eastern Europe, leading to devastating floods and 27 fatalities. A groundbreaking analysis by the Alfred Wegener Institute (AWI) reveals that climate change made the storm 9% wetter than it would have been in a pre-industrial world.** This conclusion is drawn using a novel 'storylines' approach, which provides a compelling way to visualize the impact of climate change on specific weather events by asking 'what if?' scenarios. Instead of relying solely on probabilistic attribution studies, the storyline method applies nudging techniques to climate models, which incorporates observed data like wind patterns to more accurately simulate real-world conditions. This allows scientists to pinpoint exactly how much more severe an event was due to climate change. The AWI has also introduced an online tool that uses daily analyses to allow users to explore the climate fingerprints on weather events, helping to illuminate the connections between climate change and extreme weather for both the public and media outlets. The freely available tool, hosted by the AWI, uses the CMIP6 climate model and ERA5 wind data, analyzed on the supercomputer at the German Climate Computing Center, to create interactive maps and timelines. This innovation not only aids scientific understanding but also offers practical solutions for decision-making and informed public discourse on climate-related weather disasters.